Hi everybody,
I am Tianwei, from China. I am a student of Google Summer of Code 2012.The GSoC 2012 has just reached the end! I have a wonderful summer with UMIT. Let’s have a look what we have done this summer.
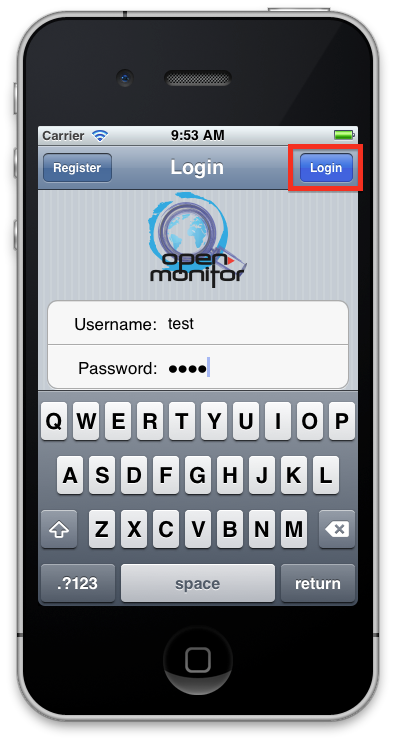
1. Login Form
When the users open desktop agent, a login form will pop up for the uses to input username and password.
About the settings button, the user can set the url of the aggregator cloud.
When the user input wrong username/password, the alter window will pop up.
2. Preference Window
a) Tests Page
In the Test Page, the user can select and delete the Test Sets, but the website test is necessary, when the user try to remove all tests, the website is still there.
At the same time, the update setting and HTTP Throttled Test Switch is here.
b) Advanced Page
Task assign, task scheduler, report uploader and test fetcher can be configured. The current desktop agent support English and Chinese, later more language will be added.
c) Peer Info Page
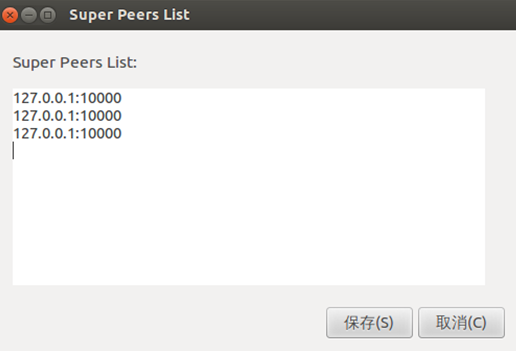
Some information about peer id, test set version, cloud URL are in this page. The users can add super peer information(ip and port) by manual.
d) General Page
In this page, the users can configure the startup, auto login, desktop notification. Version details can show us.
e) Update Page
Automatically update or manually update can be selected. The desktop will check software update information in startup stage.
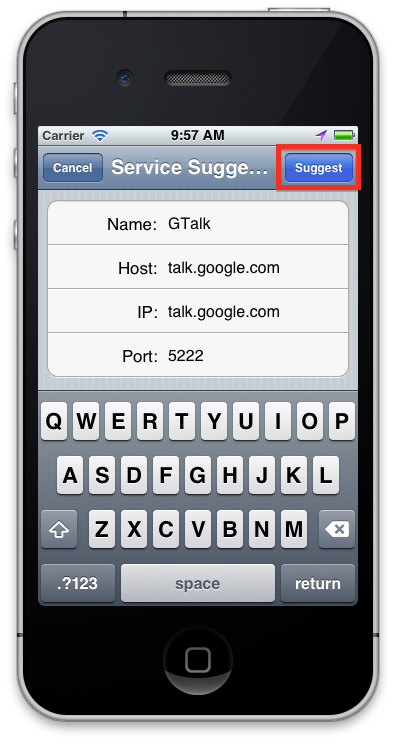
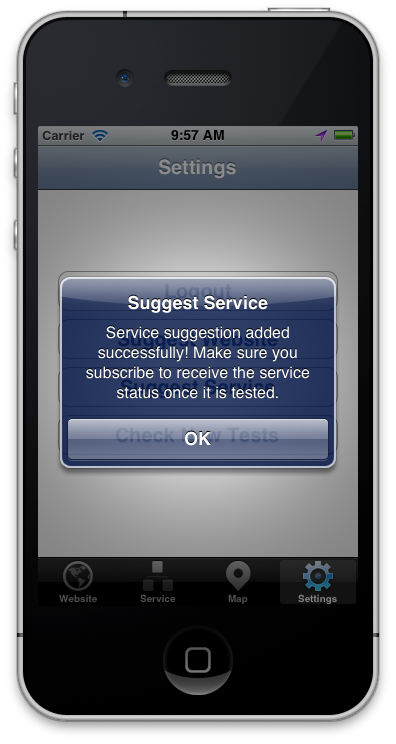
f) Feedback Page
Service suggestion or website suggestion can be sent to aggregator.
3. Logs Window
4. Event Window
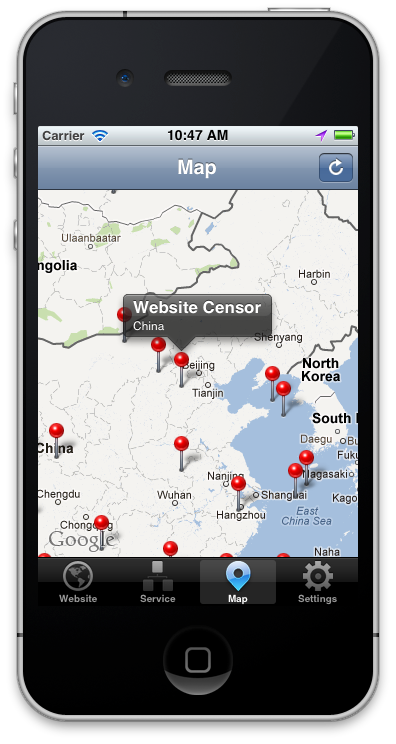
5. Dashboard Window
a) Capacity Item
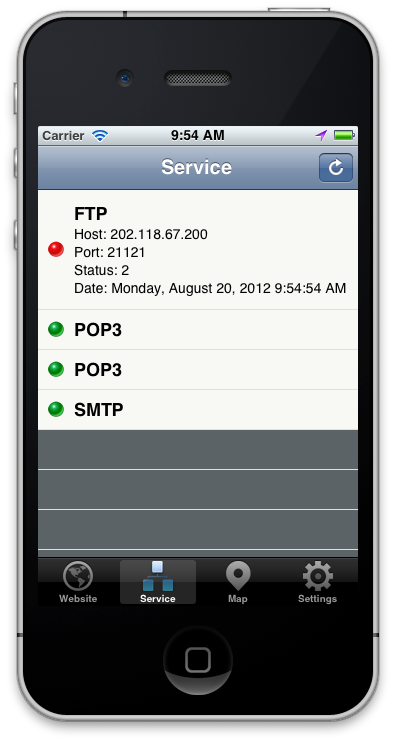
This page contains communication grade, service tests result and other peer information.
b) Sent Details
c) Task Details
d) Connection Items
e) Reports
6. About Window
7. Bug Report Window
When the desktop agent meet a crash, it will produce a crash report window which contains bug information and it will be sent to our website.
8. Software update Window
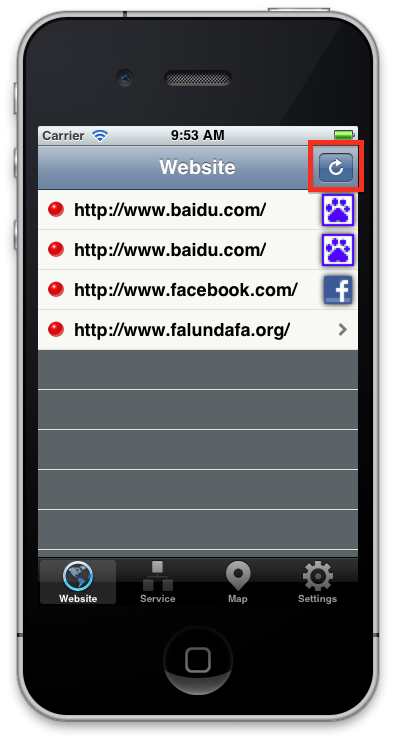
In the startup process, when the desktop agent check new version , it will show the icon in right-top position.
9. Super Peer Behavior
a) Without GUI
b) How to set super peer in desktop agent
Of course, the aggregator side should mark this peer is super peer.
c) When the super peer starts up, it will connect the peers in his peer database.
d) How the desktop agent add super peer by manual
In Preference Page -> Add Super Peer -> restart the desktop agent. The desktop agent will try to connect super peer and get necessary token information without aggregator.
e) Send report to super peer
f) Get task from super peer
g) End connection
10. Desktop Agent ICON
In Ubuntu, when you input icm-agent, it will show our Open Monitor Desktop Agent!