Wednesday, August 31, 2011

OpenMonitor Cloud Aggregator

Hi folks. During this Google Summer of Code 2011 I have been developing OpenMonitor Cloud Aggregator. It was a good experience, as I learned to work with new tools, like GoogleAppEngine, Protobuf, Django, and the work was developed in a team.
The OpenMonitor Cloud Aggregator is the central piece of the OpenMonitor, as it collects all the information sent by the agents (both desktop and mobile), analyses it, and launch alerts if some event was detected, like a shortage or a blockage. The Aggregator is also used to share the information with the users, control the release of agent versions, receive suggestions for websites and services to check.
This software was developed using Django Non-Rel (Python), uses Google Protocol Buffer to trade messages with the agents, and was deployed in Google AppEngine.

Notification System:
When the Aggregator detects some event, it sends some notifications using different systems:
  • Realtime Text Feed
The Realtime Text Feed is a simple page that lists all the recent events, and every time a new event occurs, the main information about the event slides to the top of the list.

  • Realtime Event Map
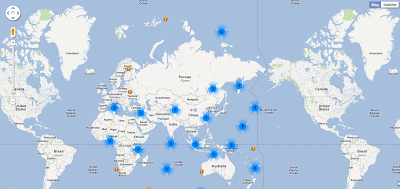
Like the Realtime Text Feed, the Realtime Event Map is a simple map that displays the events marked with pins. Every time a new event occurs, a new pin popups in the map, and if the user clicks on it, he will be able to see more information about that event. To don't overload the map with pins, the near pins are grouped together, and instead of a pin, a circle appears with the number of events occurred in that zone. If the user click that circle, the map will be zoomed it to that region, and the pins will be show alone. In the next image is shown the full map, and then the same map after zoomed in.


  • Social Networks (Facebook, Twitter)
When a new important event occurs, the information about the event will be shared in Facebook and Twitter
  • RSS Feeds
  • Email Notification
The users will be able to subscribe the events that they want to receive. After the subscription is done, when a new event occurs that matches the subscription, a new email with the information about the event will be sent to the user.


All the previous notification system only show to the user the main information about the event, however a link to page with detailed information will always be present. On this page is shown the target type (website or offline), the type of event (blockage, censor), the time of first and last detection, the name of the location, the name of ISP used by the agent, and a map with the location of the agent (green flag) and the target (red flag), the path used (in red) with the hops represented by the blue icon, and if the event was a blockage, the place where the communication was blocked is represented by a red cross.


Monday, August 29, 2011

Google Summer of Code 2011 Results

was over on August 22nd, but not for us here at Umit Project. Though we've send the code written up to the firm pencils down date, we kept working and working on our projects and some other organizational tasks that a program like GSoC requires from us. And we will still be cranking throughout the months to come, as we've got a lot to do with all these awesome projects that were developed during this summer.

Now, I'm thrilled to announce you the successful projects! Please, join us on congratulating these students and spreading the word about their projects!


  • Alan (Zhongjie Wang) developed the OpenMonitor desktop agent. It is a neat piece of software that will scan the internet from where user is connected, and provide our Cloud Aggregator with real time data about censorship, throttling and network availability in general. Useful for us to map in realtime what governments or ISPs are blocking around the globe as well as figure possible major internet outages caused by accidents or catastrophes.
  • Angad Singh had a challenging undertaking this Summer, while trying to get traceroute to work on Android. The result now features the Mobile Umit Network Scanner that will soon be released for FREE at the Android Market.
  • Diogo Pinheiro managed to create the OpenMonitor Cloud Aggregator, which is the piece that puts together all the real time data we get from our OpenMonitor desktop and mobile agents, and shows it on a very nice map with detailed description on the incident.
  • Dragos Dena developed the Umit Network Inventory Next Generation, inspired by the awesome software of the same name developed by Guilherme Polo and that we currently distribute along with Umit Network Scanner. This new breed isn't really meant to replace the original project, but to allow for users to bring network monitoring and inventory to a whole new level allowing for users to create alarms, customize them, extend monitoring agents and best of all: integrate with our cloud based Network Administrator, that I'll describe below.
  • Gaurav Ranjan managed to touch and improve four different and very complex projects we have here at Umit Project: Umit Network Scanner, Zion, RadialNet and UMPA. His contributions improved these projects will a bunch of new features and have now made all of them capable of handling IPv6 requests. We'll soon be releasing a new version of Umit Network Scanner featuring all these improvements.
  • Piotrek Wasilewski developed the Network Administrator, which is a cloud based system that allows for easily monitoring hosts status remotely. It is a very cool piece of software and is very extensible, easy to use and easy to deploy. Your days of trying for weeks to install that huge and complex monitoring system are over.
  • Zubair Nabi is the wizard that poped out of his hat the OpenMonitor mobile agent for Android. He managed to design an impressive interface and a very high quality software for helping out the world to monitor internet availability. If you have an Android, stay tunned: this will soon feature the Android Market for FREE.
We're still pushing and working hard to put everything together and make a release. Best way to get the news when it breaks, is to subscribe by or . You should probably have done this by now, anyways.

Sunday, August 28, 2011

UNS,UMPA and ZION with new features

Hi, I worked as GSOC 2011 student with UMIT project. I worked on UNS, UMPA and ZION as part of my project. The start was a little bumpy, but all is well that ends well. In this post I'll explain the work done during this summer.

  1. Umit Network Scanner :
    My goal is to release UNS 2.0 as part of my GSOC project. Most of the work has been done, and the release will follow shortly. I added following features to UNS


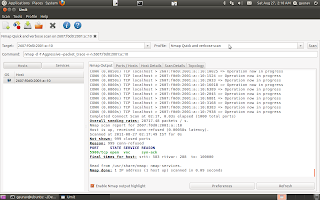
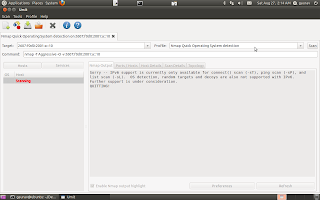
    • Support for IPv6 : nmap supports IPv6 (baring some options), but the support was missing from UNS. For the options that are not supported by nmap we display an error message with appropriate information. Screen Shot of IPv6 Scan (done on testbed of 2 computers). It uses the address checker implemented in zion.


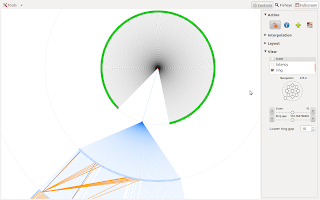
    • Radialnet Improvements: Developed algorithm with the help of Joao, for display of network with large number of networks. This solved problems of superimposition when running a scan on large network. The algorithm was implemented and the results are shown below
    • Scan Detail Improvements: Active and inactive nodes are shown in green and red respectively in the display column.

    • Fixing of some other bugs
  2. UMPA:
    In UMPA, I added support for IPv6, ICMP, ICMPv6. All the types/codes currently in use for ICMP and ICMP6 are now supported. For using the developed API's following code need to be called

    ICMP :

    >>from umit.umpa.protocols import IP
    >>from umit.umpa.protocols import ICMP
    >>from umit.umpa import Packet
    >>from umit.umpa import Socket
    >>from umit.umpa._sockets import INET
    >>from umit.umpa.utils.security import super_priviliges

    >>ip = IP(src='127.0.0.1', dst='127.0.0.1')
    >>sock = super_priviliges(INET)
    >>icmp = ICMP(type = 'ECHO' , code = 0)
    >>icmp.data = 'ABCD'
    >>first_packet = Packet(ip, icmp)
    >>sock.send(first_packet)

    TCP over IPv6 :

    >>from umit.umpa.protocols import IPV6
    >>from umit.umpa.protocols import TCP
    >>from umit.umpa.protocols import Payload
    >>from umit.umpa import Packet
    >>from umit.umpa import Socket
    >>from umit.umpa._sockets import INET6
    >>from umit.umpa.utils.security import super_priviliges

    >>ip = IPV6(src='0000:0000:0000:0000:0000:0000:0000:0001', >>dst='0000:0000:0000:0000:0000:0000:0000:0001')

    >>ip.set_flags('ds',ect=True)
    >>ip.set_flags('ds',ecn_ce=True)

    >>tcp = TCP()
    >>tcp.srcport = 2561
    >>tcp.dstport = 253
    >>tcp.set_flags('flags', syn=True)

    >>payload = Payload()
    >>payload.data = "this is umpa!"

    >>first_packet = Packet(ip, tcp)
    >>first_packet.include(payload)

    >>sock = super_priviliges(INET6)
    >>sock.send(first_packet)

    Similar for UDP over IPv6

    ICMPv6:

    >>from umit.umpa.protocols import IPV6
    >>from umit.umpa.protocols import ICMPV6
    >>from umit.umpa import Packet
    >>from umit.umpa import Socket
    >>from umit.umpa._sockets import INET6
    >>from umit.umpa.utils.security import super_priviliges

    >>ip = IPV6(src='0000:0000:0000:0000:0000:0000:0000:0001', >>dst='0000:0000:0000:0000:0000:0000:0000:0001')
    >>sock = super_priviliges(INET6)
    >>icmp = ICMPV6(type = 'ECHO' , code = 0)
    >>icmp.data = 'ABCD'
    >>first_packet = Packet(ip, icmp)
    >>sock.send(first_packet)
Packet captured by wire shark on above execution :
No.     Time        Source                Destination           Protocol Info
      1 0.000000    ::1                   ::1                   ICMPv6   Echo (ping) request id=0x0000, seq=0

Frame 1: 66 bytes on wire (528 bits), 66 bytes captured (528 bits)
    Arrival Time: Aug 29, 2011 01:21:18.734364000 IST
    Epoch Time: 1314561078.734364000 seconds
    [Protocols in frame: eth:ipv6:icmpv6:data]
    [Coloring Rule Name: ICMP]
    [Coloring Rule String: icmp || icmpv6]
Ethernet II, Src: 00:00:00_00:00:00 (00:00:00:00:00:00), Dst: 00:00:00_00:00:00 (00:00:00:00:00:00)
    Type: IPv6 (0x86dd)
Internet Protocol Version 6, Src: ::1 (::1), Dst: ::1 (::1)
    0110 .... = Version: 6
        [0110 .... = This field makes the filter "ip.version == 6" possible: 6]
    .... 0000 0000 .... .... .... .... .... = Traffic class: 0x00000000
    Payload length: 12
    Next header: ICMPv6 (0x3a)
    Hop limit: 255
    Source: ::1 (::1)
    Destination: ::1 (::1)
Internet Control Message Protocol v6
    Type: 128 (Echo (ping) request)
    Code: 0 (Should always be zero)
    Checksum: 0xfb30 [correct]
    ID: 0x0000
    Sequence: 0
    Data (4 bytes)

0000  41 42 43 44                                       ABCD
        Data: 41424344
        [Length: 4]

No.     Time        Source                Destination           Protocol Info
   2 0.000019    ::1                   ::1                   ICMPv6   Echo (ping) reply id=0x0000, seq=0

Frame 2: 66 bytes on wire (528 bits), 66 bytes captured (528 bits)
    Arrival Time: Aug 29, 2011 01:21:18.734383000 IST
    Epoch Time: 1314561078.734383000 seconds
    [Protocols in frame: eth:ipv6:icmpv6:data]
    [Coloring Rule Name: ICMP]
    [Coloring Rule String: icmp || icmpv6]
Ethernet II, Src: 00:00:00_00:00:00 (00:00:00:00:00:00), Dst: 00:00:00_00:00:00 (00:00:00:00:00:00)
    Type: IPv6 (0x86dd)
Internet Protocol Version 6, Src: ::1 (::1), Dst: ::1 (::1)
    0110 .... = Version: 6
        [0110 .... = This field makes the filter "ip.version == 6" possible: 6]
    .... 0000 0000 .... .... .... .... .... = Traffic class: 0x00000000
    Payload length: 12
    Next header: ICMPv6 (0x3a)
    Hop limit: 255
    Source: ::1 (::1)
    Destination: ::1 (::1)
Internet Control Message Protocol v6
    Type: 129 (Echo (ping) reply)
    Code: 0 (Should always be zero)
    Checksum: 0xfa30 [correct]
    ID: 0x0000
    Sequence: 0
    Data (4 bytes)

0000  41 42 43 44                                       ABCD
        Data: 41424344
        [Length: 4]


  1. ZION:
    IPv6 support added to zion. As ZION uses UMPA for sending the packets, the IPv6 implemented in UMPA was directly used here. We first detect the type of destination address (IPv6,IPv4,Domain Name). Then we correspondingly select the available source IP address (our address), and set interface accordingly for packet capture. For dynamically setting the interface depending on destination address, 
     It set this device same as for capturing the packet . 

  1.  Regular expressions used are as follows :

    ipv4

    "((25[0-5]|2[0-4]\d|1\d\d|[1-
    9]\d|\d)\.){3}(25[0-5]|2[0-4]\d|1\d\d|[1-9]\d|\d)"


    ipv6 (all address types are supported with the given regex)
    eg, ****************************************

    "^(?:(?:(?:[A-F0-9]{1,4}:){6}|(?=(?:[A-F0-9]{0,4}:){0,6}(?:[0-9]{1,3}\.){3}[0-9]{1,3}$)(([0-9A-F]{1,4}:){0,5}|:)((:[0-9A-F]{1,4}){1,5}:|:))(?:(?:25[0-5]|2[0-4][0-9]|[01]?[0-9][0-9]?)\.){3}(?:25[0-5]|2[0-4][0-9]|[01]?[0-9][0-9]?)|(?:[A-F0-9]{1,4}:){7}[A-F0-9]{1,4}|(?=(?:[A-F0-9]{0,4}:){0,7}[A-F0-9]{0,4}$)(([0-9A-F]{1,4}:){1,7}|:)((:[0-9A-F]{1,4}){1,7}|:))$"


    and a domain name list (containing top level domains). 


Here are Screen Shot of Zion scan with two different public IPv6 address .


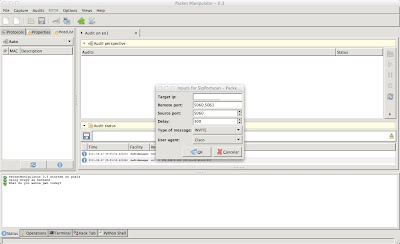
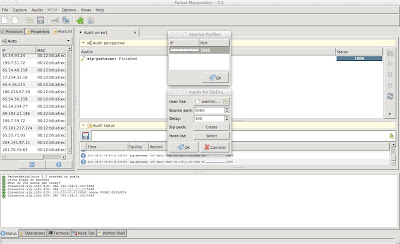
    Packet Manipulator: SIP Auditing Plugins

    Participate in an open source project and contribute something to the community is something I always wanted of doing. Google Summer of Code was my gateway and one of the best experiences I had.

    I follow UMIT since its inception, and this year I had the opportunity to meet the incredible team that maintains the project, and learn a lot with my mentor Francesco like collaborative development, project organization and Python, among many other skills that I acquired.

    Unfortunately I did not have as much time as planned for the project and I dont finished my project in the time. But I will finish the project and I have no doubt that I will continue contributing while I has something to add.

    My project is related to the area that I have more experience: IP telephony, and the area that I love: Security.

    Security in IP telephony is a very important topic. As the future of telecommunications is the world IP, the present is the convergence.
    The protocol chosen for this convergence is the SIP (Session Initiation Protocol).

    SIP Monitor:

    It is responsible for monitoring incoming TCP/UDP packets (port ranging from 5058 to 5065), in order to discover the presence of SIP Message and parse the message and save important fields.


    SIP Portscan:

    It is responsible for discovering SIP servers in case the SIP monitor is unable to find any SIP related activities or sniffing is not possible for various reasons.


    SIP Enumeration:

    It is used to discovery a list of usernames in SIP servers in case of the SIP monitor does not find any SIP username, or when the user want to collect a major number of valid logins that the SIP monitor have just discovered


    SIP Checkauth:

    It is used to test the strength of passwords in SIP authentication. It will require user interaction to provide a dictionary of weak passwords.
    This plugin is not finished yet

    SIP Fuzzing:

    It will be used to send many types of SIP messages, in order to detect crashes in SIP server (or SIP device, like a IP Phone). Each message can have some strange data, like an overflowed data field, a wrong field name, a sql query in field data and so on.
    This plugin is not finished yet

    After this, i will implement:

    SIP MiTM (To check if servers is vulnerable to Man in The Middle attack)
    SIP Hijacking
    SIP Spoofing

    And I have plans to write a IPS based in Umit, to check sip messages and detect possible attacks and notify the admin.


    The Network Administrator - monitoring your network from the cloud

    After three months of coding the Network Aministrator is ready to go. In this post I would like to describe some of its features. Since the project is now open to the whole community, I will also write about a major tasks for the next few months, where your help would be very appreciated.

    The idea


    As some of you may know, the name for this GSoC project was "Network Administrator to the Cloud Land". The title outlines the basic concept of the NA, which is creating monitoring tool that will work in a computing cloud as a web application. This idea seems to be very simple, however a product like that hasn't yet been created (correct me if I'm wrong). But why should we care about developing such an application? Well, computing clouds give us cutting edge scalability and reliability--the features that we are looking for while creating a monitoring tool, right? Moreover, web interfaces provide us with high availability and usability at the same time. In Network Administrator we are using these qualities and we take monitoring software to the next level.

    The basic concepts


    Now I would like to present you some of the basic terms and concepts we're using in NA.

    Event

    An Event is a single information about what happened on a server. Description of event contains a message (and its shorter version), type of event (e.g. "WARNING"), time stamp, name of network protocol, source host and optionally some additional data serialized as a JSON [1]. Based on these data we should know everything about an event: when, where and what happened.

    Host and Network

    Every event has its source--a host, which is represented by a name, IP address (both v4 and v6) and optionally a description. Administering a large number of hosts may be difficult, but you can manage them easier by aggregating them into a network with unique name. [2]

    Report

    Reports are a basic tool for regular monitoring of a host or network. A report lets us to see events in a specific period of time, and export them into user-friendly format (e.g. PDF). [3]

    Web API

    One of the greatest features of the Network Administrator is its RESTful API, which allows external applications to report events and to read selected data. Authorization is provided by the xAuth mechanism, which is a slightly modified OAuth technology. For encryption we are using SSL, which is a standard for this kind of services. Data format chosen for this API is JSON. [4]

    Plugins

    Monitoring a network is a very ambiguous term, therefore monitoring tool should be a highly extensible software, to let user easily define what data he wants to see and how. With the basic knowledge of Python and Django template language you can create a plugin that will show additional data about events or networks. Or it can show the same data but using different representation, like a chart. There are lots of possibilities now, and there will be much more of them in the future.

    Implementation details


    Django is a powerful and mature web framework, so I had no doubts to use it in the Network Administrator. However, this project is different than any other application I've done before--it is entirely based on NoSQL backend. Using non-relational database we can create system that is quicker and lighter. Besides, it's much easier to change data model during development process on database that is horizontally scalable. Unfortunately Django doesn't support NoSQL backends by default. But there is a cool project called Django-nonrel [5], created to meet this requirement. Its authors claim that the latest release is stable. Indeed it works well and I think we can use it in production environment.

    As I wrote above the web API is a crucial part of the NA. It was implemented based on Piston framework [6]. Using this simple Django application we can easily create RESTful services by defining handlers for GET, PUT, POST and DELETE methods. It also provides nice authentication backends, e.g. OAuth.

    For generating reports we are using Geraldo Reports--another Django application [7] with lots of nice features.

    Since the Network Administrator was designed to work in a computing cloud, I had to test it in one of those. The Google AppEngine seemed to be the perfect choice. Why? It is completely free to deploy there startup application like this, it has great documentation and it provides services like e-mail, cron, database viewer etc. Thanks to Djangoappengine [8] app I could easily set up NA on Google's servers.

    Charms of using NoSQL


    One of the most important lesson I learnt during development of the NA was to use NoSQL databases. At one moment I had to forget about JOINs, many-to-many relations support, full-text search etc. Now I have to admit it was quite amazing experience, that learnt me to focus on every single query I write.

    Review of the most important features


    Now I would like to show you some of the most important features of the Network Administrator.

    Dashboard--your work starts here


    Dashboard--your work starts here


    Browsing and searching events


    Managing a host


    Setting up alerts


    Managing a network


    Report exported to a PDF


    TODO


    Hoping that some of you may be interested in contributing to the project, I wrote a short TODO for the next few months. It's not a complete list of tasks but it shows major priorities for the Network Administrator.

    Name

    Does anybody here believe that "the Network Administrator" is a final name for this project? No way! It should be short and catchy if we want to efficiently promote this idea.

    Testing and refactoring

    We should write much more tests for all of project's applications. I'm also aware of need to spend more time on code refactoring.

    Graphic design

    The goal is to create a very good-looking interface with a cutting-edge usability. It's the easiest way to show people that our project pretends to be the high end web tool. To reach this goal we have to find (hire?) a professional graphic designer.

    Usability and new features

    Regardless of the plan to create a new layout, we should think about new features that would make this tool more usable and user-friendly. It's easy to extend the NA with plugins so we just have to think: how to make NA a monitoring tool that we would like to use?

    How to start with the Network Administrator


    To start just register a new accout at . After pressing "Register account" button you should receive a mail with an activation link. Click it and that's it--you can log in! Then set up your servers to report events to your account [9]. Now you can monitor your network the way you never did!


    [1] http://dev.umitproject.org/projects/na/repository/revisions/master/entry/netadmin/events/models.py
    [2] http://dev.umitproject.org/projects/na/repository/revisions/master/entry/netadmin/networks/models.py
    [3] http://dev.umitproject.org/projects/na/repository/revisions/master/entry/netadmin/reportmeta/models.py
    [4] http://dev.umitproject.org/projects/na/repository/revisions/master/entry/netadmin/webapi/handlers.py
    [5] http://www.allbuttonspressed.com/projects/django-nonrel
    [6]
    [7]
    [8] Djangoappengine authors are the same guys who are responsile for Django-nonrel project: http://www.allbuttonspressed.com/projects/djangoappengine
    [9] In the next post I'll show you step by step, how to set up NA with the latest Network Inventory

    Saturday, August 27, 2011

    OpenMonitor Mobile Agent: Screenshot Walkthrough

    As mentioned in an earlier post, the GUI of the Mobile Agent has three main activities: InformationActivity, MapActivity and ControlActivity. This current post is going to serve as a user-guide using screenshots of the application. By default, the InformationActivity is launched at start-up:


    This activity lists the connectivity scan results of both websites and services. As shown in the image, each website item can be selected to view more detailed results. For instance, selecting Google.com brings us to the following screen:

    This view lists the status, status code, throughput and response time of Google.com. Similarly, clicking on View Services leads us to the following list of services:

    Like the websites list, a service can be selected to view scan details.
    The next tab is of MapActivity. Clicking it launches the default mapping package: Google Maps. Each connectivity event -- website or service censorship is depicted by a red dot:

    The same map frame in OSMDroid Maps:

    Each red event dot can be selected to launch a dialog with more details: test type, event type and time of last scan:

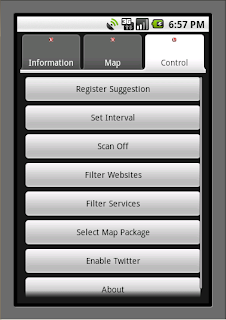
    The last tab is of ControlActivity and it allows the user to tweak various application-wide parameters:

    Friday, August 26, 2011

    Mobile Woes: Working on a large-scale Android application

    Engineering the ICM Mobile Agent this summer, I encountered a number of challenges which were both exciting and nerve-wrecking at the same time. Working on a mobile platform and application places one in a unique situation because one does not have access to unlimited resources and power, and various code libraries. As a result, one needs to be mindful of various run-time quirks that can significantly reduce the efficiency and usability of the app. In this post I am going to retrace my path through the course of the summer and highlight three significant hiccups that I faced.

    1. Cost of cryptography
    Most networked applications make use of cryptography in one form or the other. Important among these are encryption and authentication. For both, one has the option of using either public or private key cryptography. Though the end-goal might be the same, the algorithmic differences between the two can have major performance differences. For example, in one instance RSA public encryption/decryption of a 20 byte String took 5987/4471 ms, respectively. In contrast, AES secret key encryption/decryption took 22/13 ms, respectively. Clearly, the latter is many orders of magnitude faster than the former. In an application which encrypts every communication message, the choice of the encryption algorithm can make a major performance difference.

    2. Task repetition
    As an integral work horse of the ICM, the mobile agent runs connectivity tests for every monitored website and service. The periodicity of these tests can take its toll on the battery time. Naively running these tests one after the other will drain the battery in no time. Therefore, it is important to be aware of some of functional aspects of your application and how to optimize them. Selecting a good periodicity interval using manual profiling can help to conserve the battery.

    3. Communication frequency
    The frequency with which your application communicates with other entities in the network can also affect battery consumption. Therefore, a communication model in which the mobile client initiates communication by consuming a RESTful webservice API in a request/response model is the most efficient for two major reasons: 1) It puts the client in charge of the communication by allowing it to start communication if and when required without any polling cost, 2) It pushes the computational cost of some intensive tasks from the client to the server.

    Network Scanner for Android : A summary


    Working on the Google Summer of Project with Umit has perhaps been the best learning experience for me. I am a Computer Engineering undergraduate and in our course of study, we learn about a lot of theoretical concepts and ideas. Working for this project has given me an opportunity to apply those concepts into an application that will be helpful to many users. It is a true practical application of what is in books.

    Network Scanner for android is a Network administration tool that lets you monitor your network for services and hosts. It supports the following features -

    1. Host Discovery
    a. ICMP packet (isReachable in Java)
    b. native linux ping
    c. TCP Connect
    d. TCP Multiport connect
    e. UDP
    f. ARP Scan

    2. Port Scanning
    a. SYN Scanning (root)
    b. FIN Scanning (root)
    c. TCP Connect scan
    d. UDP Scan

    3. Traceroute (root only)

    4. A port of nmap for android (root only)

    The application lets you save the scans, view log files and gather extra network information. You can find more information about the project at the Project page on dev.umitproject.org

    The main learnings from this project would be
    1. A very in-depth study of port scanners
    2. Raw packet manipulation
    3. UNIX sockets programming
    4. Android programming
    5. Native android programming and cross-compiling
    6. Various linux networking utilities
    7. nmap

    I got to spend a lot of time with low-level networking stuff while writing the port scanner. At one point of time I could even read raw packets and infer the flags without even looking at the reference. It was a really good learning experience.

    Even though I am done with Google Summer of Code, I would really be interested in continuing the development of this project in the future. Its an interesting project and mobile is the future. And now that almost all our phones run Linux (Android :P), we should have more control over what we can do with them. This application is a very good example of exploring the power of Linux on handheld devices.

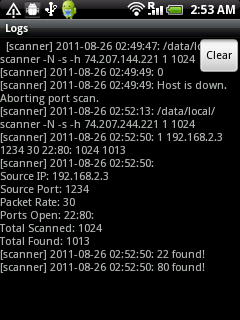
    Here are some screenshots from the application -

    Host Discovery

    Log File Viewer

    Nmap output

    nmap XML parsed output

    Port Scan using SYN Scan
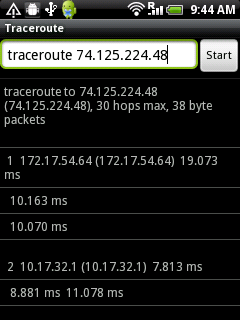
    Traceroute
    Menu 

    Menu

    Thursday, August 25, 2011

    Network Inventory New Generation

    So, Google Summer of Code 2011 came to an end a few days ago. I hope it was a very fun summer for all GSoC students out there. For me, at least, it sure was. I got to work at a project that caught my attention in the pre-application period as having the potential to be a very educative experience for me. And it was, not only because of the project itself, but because of the great community here at the Umit Project. I would like to thank Adriano, Luis and of course my mentor Rodolfo for being helpful and supportive during this summer.

    I have learnt a lot of useful stuff: network programming (and also Twisted Matrix with it), a better understanding of Python programming, packaging and installation procedures and of course, some improved debugging skills with all of it:-). But most important for me, being a very disorganized person, I learnt to organize my time much better working at such a project.

    As you may have noticed from the title, I worked at Network Inventory: New Generation, a platform to monitor hosts in your network trough asynchronous events sent by those hosts. The NI:NG is composed of 2 main components:

    • Network Inventory Agent. A daemon/service that is installed on the host that should be monitored and sends out notifications when something happens. It offers an modular design so the users can add new monitoring functionality based on their needs (or better said, on what is needed to be monitored on that host).
    • Network Inventory Server. Also a daemon/service that receives notifications from the agents installed on the monitored hosts. It stores those notifications and provides an interface so other applications can view them. Besides receiving notifications from agents, it also provides support for SNMP Traps and it can even be extended to support new monitoring protocols.
    Besides these 2 main components, a Network Inventory frontend was also developed that connects to the Server Interface and allows the user to view notifications, search trough them, edit server and agent configurations and view host information. 

    As a very detailed view of the platform wouldn't be such an interesting read, here is a brief summary of some of the features:
    • A Device Sensor agent module that generates notifications based on some device variables: RAM Load, CPU Load, HDD space, network traffic, open ports and others. The user can define under what conditions should a notification be generated. For example, you can say that you want a notification sent if the CPU% is over 90% over the last 5 minutes, if the remaining space on drive C:\ is under 10GB or if less than 1KB of data was received in the last 30 minutes trough your network connection. Some examples of course may not be interesting and relevant, but the conditions under which notifications are sent can be customized to your needs.
    • Possibility to encrypt the notifications sent by the agents to the server and the data between the GUI and the server.
    • An EMail Notifier server module that sends e-mail notifications for some pre-defined notification types.
    • A SNMP server module that allows the server to receive SNMPv1, SNMPv2c and SNMPv3 Traps/Notifications.
    For the Network Inventory GUI, I will just post some screenshots here as I think it will better describe it :-).


    OpenMonitor Desktop Agent

    Hi, everyone. The Google Summer of Code 2011 has just reached the end. We've had a quite exciting summer this year because of the project we are incubating , the Internet Connectivity Monitor. Along with the worldwide voices against Internet censorship, ICM will be the sentry in the front line to discover any kinds of Internet connectivity problems.
    ICM Desktop Agent is the client side software running on user's computer. It supports Windows, Linux, and Mac OS platform. We develop this software using Python, Twisted and PyGTK. The functionality of the desktop agent is running in background and doing connectivity testing against some websites and services. The connectivity testing tasks are assigned by the aggregator. It also allows user to manually control the behavior of the agent. Users will have an overall view of the connectivity status of current region and the whole internet though the connectivity map, which is based on Google Map and OpenStreetMap. And also, they can see the testing results and the connectivity statistic data in localhost.
    We are making ICM as a global monitoring network, so the agents have the capacity of connecting to each other and sharing their knowledge, mainly are reports. The desktop agents forms a two-tier network. Super desktop agents are the first tier, and normal desktop agents are the second tier. The super agents are the ones more powerful and stable, which could be a bridge between the aggregator and the normal agents when the normal agents couldn't reach the aggregator. And also they can provide some balancing services to the normal agents. We are trying to build this network robust, and eliminate the island phenomenon among peers.
    Now the ICM Desktop Agent is near it release date. We are looking forward to its roll-out.
    Through this summer's coding work, I've learnt a lot of Python programming skills, and have gotten familiar with the python modules and Twisted framework. I also learnt how to write asynchronous networking programs with Twisted. That's a bit challenging, and it's quite different from the programming patterns I've used before.
    Some screenshots:


    Tuesday, August 02, 2011

    JUnit "java.lang.VerifyError" failure in Android and Maven

    JUnit test suites in Android constitute a separate Android project that is deployed alongside the application under testing [1]. Users often make the mistake of adding external libraries as dependencies to both projects which leads to java.lang.VerifyError failure caused by the conflicting external library. In case of Eclipse, the standard solution is to add the external library as dependency to only the main project and then export it to the test project [2]. But unfortunately, this solution is not applicable when Maven is used to run the test suite [3].

    In case of Maven, the user should add the external library as dependency to the pom.xml of both projects but with different scope options.
    For example, if the external dependency is Google Protobufs, this should be added to the main project pom.xml:

    com.google.protobuf
    protobuf-java
    2.2.0
    compile

    while to the test project pom.xml add:

    com.google.protobuf
    protobuf-java
    2.2.0
    provided

    A compile scope dependency is propagated to all classpaths of the project and at runtime is available to dependent projects which list the dependency scope as provided.

    3.

    Using Google Protobufs in Android and Maven

    In this post, we are going to build upon my previous post on using Maven as a build manager for Android projects.
    have recently found traction in serialization of structured data. It automatically produces code in C++, Java and Python from .proto file for use in user programs. A proto file consists of messages that are compiled using the protocol buffer compiler to produce code with getters, setters, builders etc.. The user is directed to the for more details.
    The first task is to add Protobufs as a dependency to your Android project pom.xml:

    com.google.protobuf
    protobuf-java
    2.2.0
    compile

    Next, to automatically compile the .proto to the equivant .java, add the following build task to your project pom.xml:

    ${project.artifactId}
    src
    maven-antrun-plugin
    generate-sources
    generate-sources
    src
    run

    Replace path_to_proto with the path your .proto.
    Having taken care of dependencies and automatically build, now, let's focus on the .proto itself.
    The .proto should have the following two lines at the very start:

    package org.x.x;
    option java_outer_classname = "Filename";

    where org.x.x is the Java package to which the resultant "Filename.java" should be added.

    Let's take the example of a .proto which consists of just one message, Test:

    message Test {
    required int32 integerField = 1;
    optional string stringField = 2;
    repeated int64 doubleField = 3;
    }

    int32 is compiled to a Java int while int64 is compiled to a Java double.

    To build the Test message in Java after compilation:

    Test test = Test.newBuilder()
    .setIntegerField(10)
    .setStringField("Hello")
    .addDoubleField(1.0)
    .addDoubleField(2.0)
    .build();

    Note that optional fields can be skipped during a message build while more than one repeated field objects can be added as they constitute a Java List.

    To write the message to an OutputStream:

    test.writeTo(outputStream);

    To get a ByteArray equivalent:

    byte[] byteArray = test.toByteArray();

    To generate a Test message from a ByteArray:

    Test test = Test.parseFrom(byteArray);

    In addition to these methods, standard get, set, has and is methods are also provided.

    Newer Posts Older Posts Home